
Introduction
Manufacturing planners know the frustration well: a schedule that looks perfect at 7 AM is unraveling by 9 AM. A machine goes down. A setup runs 40 minutes over. A shift change loses context. By noon, the plan is a fiction.
This isn't a failure of effort — it's a failure of scheduling method. Most production schedules are built around dates rather than logic, and maintained by feel rather than by data. When reality deviates (and it always does), there's no structural foundation to absorb the hit.
According to Deloitte, poor maintenance strategies alone can reduce a plant's productive capacity by 5% to 20%, and unplanned downtime costs industries an estimated $50 billion per year. Scheduling failures compound that exposure.
The Planning & Scheduling Excellence Guide (PASEG), published by the National Defense Industrial Association (NDIA), provides a rigorous framework for building schedules that don't just look credible — they are credible. This article covers PASEG's core principles, schedule levels, and what separates a reliable schedule from one that collapses under the first disruption.
Key Takeaways
- Planning and scheduling are distinct disciplines; conflating them produces unreliable schedules
- PASEG's eight Generally Accepted Scheduling Principles (GASP) apply across industries, including manufacturing
- Schedules must be structured in levels (L1–L4) to match the right audience with the right level of detail
- A sound schedule integrates scope, logic, resources, and risk — not just task completion dates
- Schedule health is measurable with specific metrics, not subjective status reports
What Is Planning & Scheduling Excellence?
Planning and scheduling excellence is the disciplined practice of creating, maintaining, and using schedules as active decision-making tools — not documentation artifacts filed after the fact.
PASEG draws a clear line between the two disciplines:
- Planning defines what needs to happen, in what sequence, and under what management approach
- Scheduling assigns time, resources, and dependencies to that plan — modeling when and how work will actually occur
When planners collapse these into a single activity (jumping straight to dates before logic is defined), the result is a constraint-driven schedule rather than a logic-driven one. It looks like a schedule. It doesn't behave like one.
What Makes a Schedule "Sound"
PASEG characterizes a sound schedule as one that merges cost, technical data, and resource information to support three functions:
- Management decision-making
- Tracking past performance against a baseline
- Predicting future performance with credible forecasts
This is a higher bar than simply recording who is doing what by when. A sound schedule tells you where you stand, why you're there, and what happens next.
That definition matters most when conditions are unpredictable — and manufacturing shop floors are rarely anything else.
Why This Matters on the Shop Floor
Manufacturing environments amplify every scheduling weakness:
- Setups vary by sequence and machine
- Shifts create hard capacity boundaries
- Work orders depend on upstream operations completing on time
- Material shortages cascade unpredictably
McKinsey reports that predictive maintenance alone can reduce machine downtime by 30% to 50% — but without a schedule that models capacity and dependencies accurately, even that reduction won't prevent the downstream chaos a single unplanned event creates.
In a high-variability shop floor environment, a schedule that can't reflect reality can't guide decisions — and that gap shows up fast when something goes wrong.
The Generally Accepted Scheduling Principles (GASP)
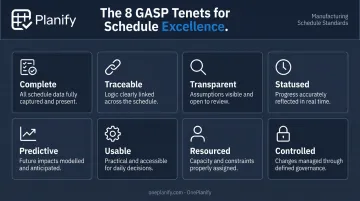
PASEG's eight GASP tenets form the foundational framework for building, maintaining, and using schedules that function as genuine management tools. They apply regardless of industry or scheduling software.
| GASP Tenet | What It Requires |
|---|---|
| Complete | The schedule captures the full scope of authorized work — no orphaned tasks |
| Traceable | Logic is integrated horizontally and vertically across schedule levels |
| Transparent | The schedule is understandable, reviewable, and verifiable by stakeholders |
| Statused | Actual progress and remaining work are reflected on a regular cadence |
| Predictive | The schedule forecasts future dates using logic, durations, and performance data |
| Usable | The schedule provides timely, reliable information for management decisions |
| Resourced | Resources needed to execute the work are accounted for in the plan |
| Controlled | The schedule is built, maintained, and changed through controlled processes |
Completeness and Traceability
A schedule missing tasks isn't just incomplete — it's misleading. PASEG requires that every authorized work element appear in the schedule, with traceable logic connecting activities horizontally (across the timeline) and vertically (across schedule levels). Open-ended tasks with no predecessors or successors create dead zones where delays go undetected until they've already cascaded.
Resource Realism
Over-allocated schedules fail not because of poor execution, but because the plan was never achievable to begin with. GASP requires schedules to be resource-loaded and leveled against actual capacity. In manufacturing, machine capacity and labor shifts are finite — a schedule that ignores those limits will always fall short.
This is the core problem finite scheduling tools like OnePlanify are designed to solve: respecting actual capacity rather than assuming unlimited resources.
Risk-Informed Scheduling
Schedule margin — time reserve built into the plan — should be tied to identified risks, not padded arbitrarily. PASEG treats margin as a risk mitigation tool. A schedule with no margin has no ability to absorb the variability that every manufacturing environment generates daily.
Control, Currency, and Active Use
A schedule that was accurate three weeks ago but hasn't been updated is no longer a management tool. GASP requires schedules to stay current and useful through three disciplines:
- Regular status updates that reflect actual progress and remaining work
- Documented change control so every revision has a traceable reason
- Active use by leadership to drive decisions, not just report on them
If the schedule isn't informing real calls, it has already failed its primary purpose.
Understanding Schedule Levels: L1 Through L4
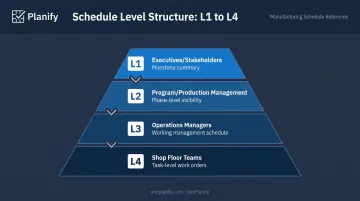
Schedules serve different audiences. The same level of detail that helps a shop floor operator execute their next job would bury an executive in noise. L-level scheduling solves this by structuring a single schedule network into progressively summarized views.
| Level | Audience | Content |
|---|---|---|
| L1 | Executives, stakeholders | High-level milestone summary; key program events only |
| L2 | Program/production management | Summary milestones with phase-level visibility |
| L3 | Project/operations managers | Working schedule with sufficient detail for management decisions |
| L4 | Shop floor teams, operators | Detailed task-level schedule; individual operations and work orders |
Vertical Traceability: Why It Matters
The GAO Schedule Assessment Guide is direct on this point: lack of vertical integration creates inconsistent dates across schedule levels and generates conflicting expectations between managers and activity owners.
Vertical traceability means a milestone at L1 must be mathematically supported by the tasks at L3 and L4. When a setup overrun delays a work order at L4, that delay should roll up automatically to the L3 management view and flag at L1 if it threatens a key milestone. Manual reconciliation between levels introduces errors and lag, making the summary schedule structurally unreliable — not just slow.
Practical Implication for Manufacturing
Shop floor schedulers live at L3 and L4. Production managers and plant leadership consume L1 and L2. The scheduling system must support this roll-up automatically. When it doesn't, planners spend time reformatting data instead of managing performance. The result: executives make decisions against milestone data that's already out of date.
Building and Maintaining a Reliable Schedule
Defining Scope and Logic Before Dates
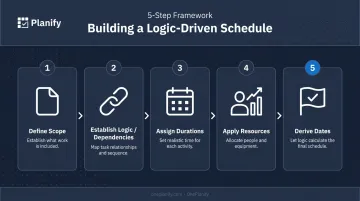
The single most common scheduling error is starting with dates. A date-first schedule is a constraint masquerading as a plan. PASEG and the GAO both require that schedule development follow this sequence:
- Define the complete scope of work — every activity required to achieve the outcome
- Establish logical dependencies — finish-to-start, start-to-start, and other relationships that reflect how work actually flows
- Assign durations based on historical data or validated engineering estimates
- Apply resources against finite capacity
- Derive dates from the logic network — not the other way around
The critical path — the longest chain of dependent tasks — determines the earliest possible completion date. Managing float on near-critical paths is where schedule risk lives. In manufacturing, CPM applies directly to production routing: Gupta's foundational work demonstrated this by repeatedly calculating the critical path through production processes and routing parts to stay off that path, reducing overall cycle time.
For task duration sizing, GAO guidance is practical: durations should be short enough to support discrete progress measurement, and generally should not exceed the management reporting period. Tasks under one day may indicate excessive fragmentation; tasks running weeks without interim milestones lose visibility. In a manufacturing context, work orders should be sized to be measurable — trackable against actual start and finish without requiring estimation of percent complete.
Maintaining Schedule Integrity Under Disruption
Real-world shop floors generate constant disruption. Schedule maintenance isn't optional — it's what separates a living plan from a static document. Common disruption sources include:
- Unplanned machine downtime
- Setup time overruns (especially in high-mix environments)
- Material shortages and late deliveries
- Shift transitions and absenteeism
- Rework and quality escapes
A schedule built with finite capacity modeling, realistic margin, and traceable logic can absorb many of these without requiring a complete rebuild. The key is regular statusing — recording actual start and finish dates, updating remaining durations — on a defined cadence. A schedule that is only updated when something goes wrong has already lost its predictive value.
Tools like OnePlanify treat setups, shift changes, dependencies, and disruptions as native scheduling constraints — not edge cases to work around manually — which helps maintain statusing discipline without requiring complex configuration.
Change control is non-negotiable. When disruptions or scope changes occur, process them through a documented change workflow rather than silently adjusting the schedule. Silent adjustments corrupt the baseline — the one reference point that tells you whether performance is improving or degrading. Without a clean baseline, schedule health metrics lose their meaning entirely.
Measuring Schedule Health and Performance
Subjective status updates — "we're on track," "slight delay but manageable" — are not schedule management. PASEG provides quantitative tools for assessing whether a schedule is credible and whether the project will finish on time.
Key Schedule Health Indicators
DCMA's schedule assessment framework (DCMA-EA PAM 200.1) sets concrete thresholds for schedule quality:
- Missing logic: Should not exceed 5% of incomplete tasks
- Leads (negative lag): Target is 0%
- Hard constraints: Should not exceed 5%
- High float (over 44 working days): Should not exceed 5%
- Invalid dates: Target is 0%
- Missed tasks: Should not exceed 5%
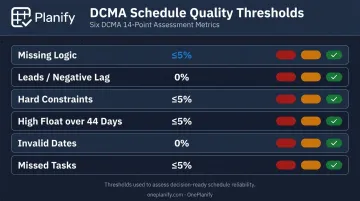
These aren't theoretical targets. They're the thresholds used to assess whether a schedule is reliable enough to make decisions from.
Once you know your schedule meets basic quality thresholds, the next question is whether it's staying healthy as work progresses. That's where leading indicators come in.
Total Float Consumption Index (TFCI)
TFCI is a leading indicator of schedule health. The formula:
TFCI = (Project Actual Duration + Critical Path Total Float) / Project Actual Duration
Plain language: it measures how efficiently float is being consumed relative to time elapsed. If a project is 30% through its timeline but has consumed 60% of its total float, TFCI signals schedule degradation before any milestone is missed.
A concrete example: a 100-day project with 20 days of total float on the critical path. At day 30, if only 4 days of float remain (rather than the expected ~14), TFCI reveals the problem weeks before the first late milestone appears. Traditional milestone tracking would show "on schedule" until the deadline slips.
Schedule Performance Index for Time (SPIt)
Earned Schedule methodology introduces SPIt as a time-based performance index:
SPIt = Earned Schedule / Actual Time
Unlike traditional EVM's SPI — which is value-based and converges toward 1.0 as projects near completion regardless of actual performance — SPIt remains meaningful throughout the project lifecycle.
An SPIt below 1.0 means the project is earning schedule slower than time is passing. That's a genuine leading indicator of a late finish, not a statistical artifact.
These metrics apply to any industry. You don't need a defense program or earned value management system to use them — you need a baseline, a logical schedule, and the discipline to update it regularly.
Frequently Asked Questions
What are L1, L2, L3, and L4 schedules in planning?
L1 is a high-level executive milestone summary; L2 adds program-level summary milestones; L3 is the working management schedule with sufficient detail for oversight; L4 is the detailed task-level schedule used by individual teams or operators. Each level must be vertically traceable to the others — a delay at L4 should surface automatically at L1.
What are the Generally Accepted Scheduling Principles?
GASP are the eight foundational tenets from NDIA's PASEG for building and using credible schedules: Complete, Traceable, Transparent, Statused, Predictive, Usable, Resourced, and Controlled. They apply to any industry and define what separates a schedule used as a management tool from one that is purely documentation.
Which schedule format is best for tracking progress on a predictive project?
A Gantt chart built on a logic-driven critical path (CPM-based schedule) is the standard for predictive projects. It shows task sequences, dependencies, float, and baseline versus actual progress in a visual timeline, giving planners what they need to identify drift early.
Which project planning document organizes work along a visual timeline for schedule development?
The Gantt chart (bar chart schedule) organizes work visually along a timeline. In rigorous programs, it is built from a Work Breakdown Structure (WBS) to ensure all scope is captured before any dates or dependencies are assigned. Both PMI and GAO treat this sequence as a prerequisite for credible schedule development.
What is the difference between finite and infinite scheduling?
Infinite scheduling assigns work without regard to capacity constraints, assuming unlimited resources. Finite scheduling accounts for actual capacity limits — machine availability, shift hours, labor headcount — and schedules only what can realistically be executed. For shop floor production planning, infinite scheduling produces plans that look good on paper and fail on the floor.
What is schedule margin and why does it matter?
Schedule margin is time reserve built into the schedule and tied to identified risks — not arbitrary padding. It exists to absorb delays without pushing the end date. Margin should be managed actively as risk matures and burns down, not treated as hidden slack. A schedule with no margin has no capacity to handle variability, and manufacturing environments constantly generate variability.